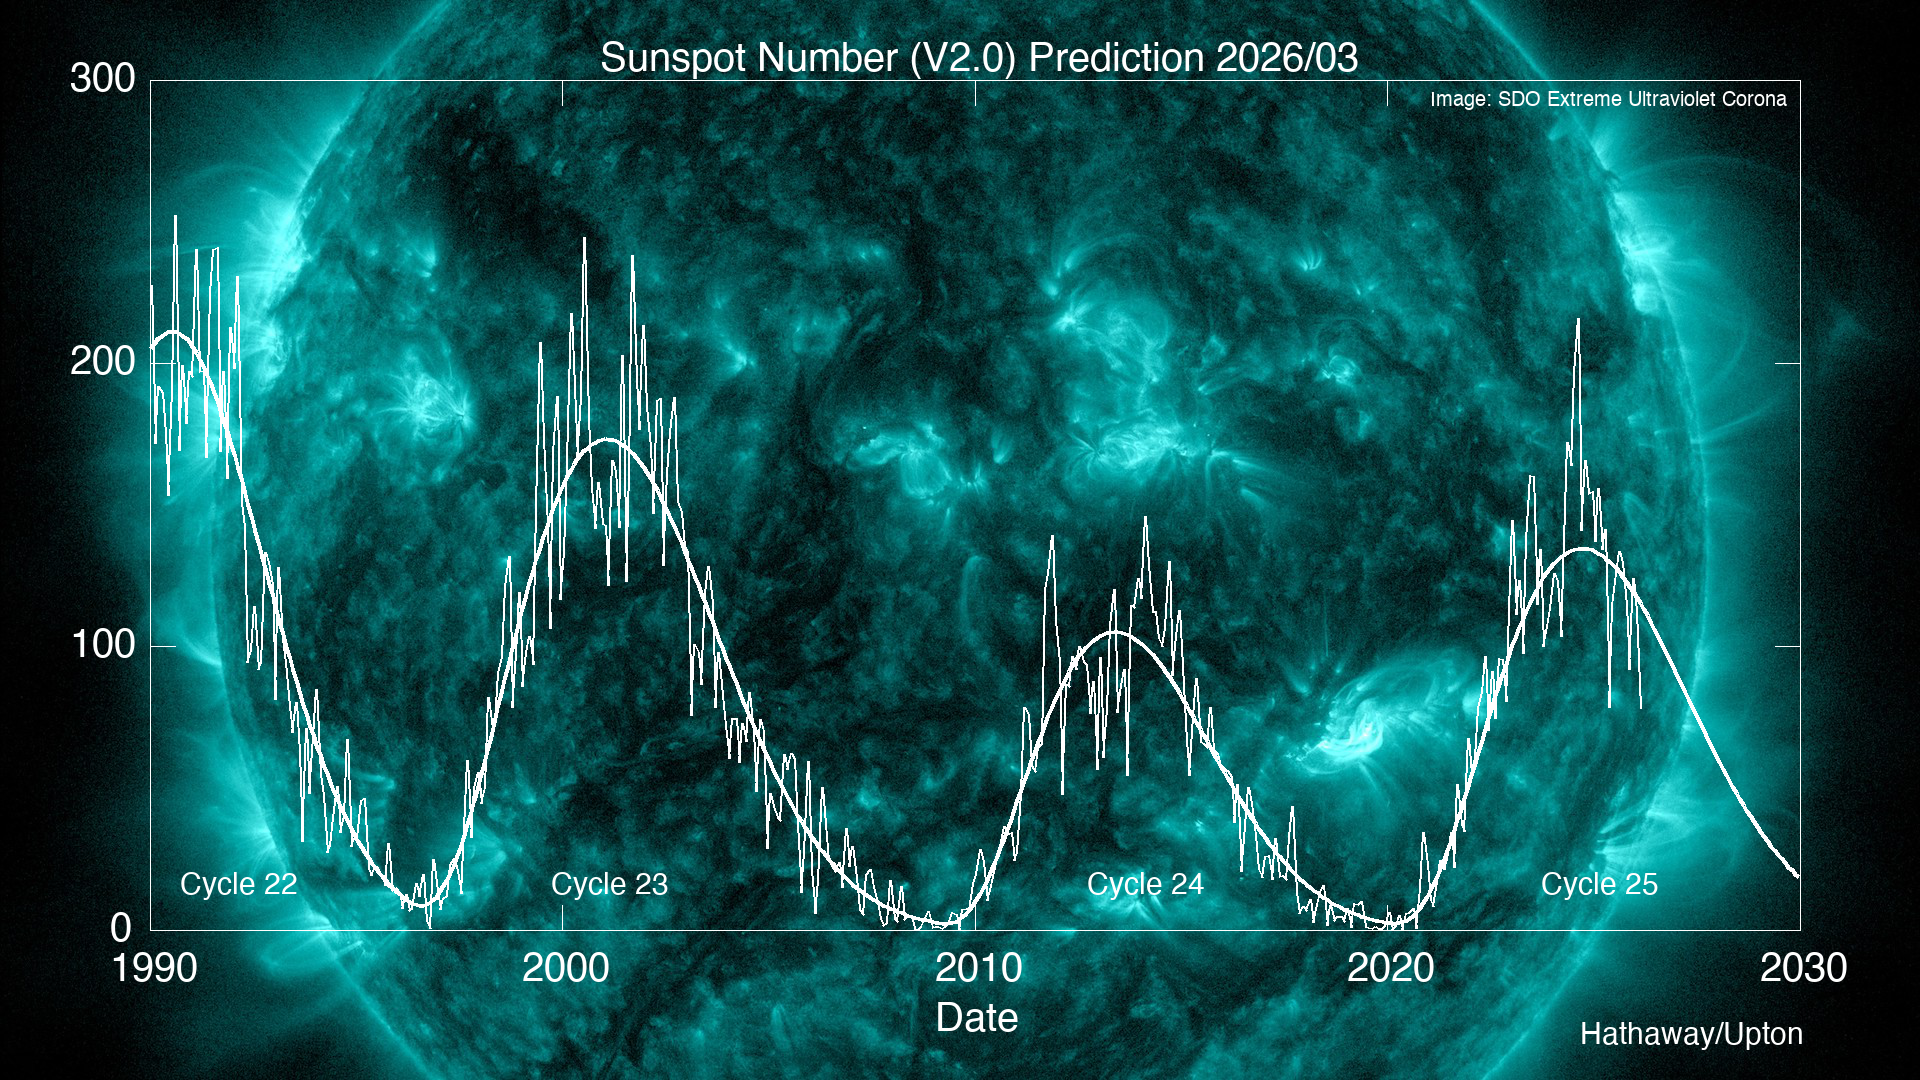
Our latest predictions for cycle 25. We have now passed the maximum of Cycle 25 - determined by the peak in the 13-month running mean of the monthly sunspot numbers. Cycle 25 maximum is now established as 160.8 in October of 2024. We are now five years into cycle 25. At this point curve fitting becomes reliable but guidance is still needed from the most reliable precursors - the Sun's polar field strength at cycle minimum and the minimum in geomagnetic activity which usually occurs shortly after minimum (see our 1999 paper ). Curve fitting based on our 1994 paper now indicates that cycle 25 will be bigger than cycle 24 (but smaller than cycle 23 - an average sized cycle), in good agreement with the polar fields and geomagnetic precursors (see further discussion below).
This is our latest solar cycle prediction. The prediction data used to make this plot is in this text file. This diagram with an alternative background is available here.
The Sun's polar fields at sunspot cycle minimum have been the most reliable predictors of all three of the last three cycles. Data from the Wilcox Solar Observatory provide a prediction for cycle 25 based on the average ratio of sunspot number maximum to the polar field strength at minimum for these three cycles. Using the polar field strength at cycle 24/25 minimum in December of 2019 indicates a maximum sunspot number of 120 for cycle 25.
Geomagnetic activity near cycle minima has been used to predict cycle maxima since the work of the Russian researcher Ohl in 1966. This precursor has the advantage of having data for the last 13 sunspot cycles! The minimum in geomagnetic activity seen in the geomagnetic aa index is tightly correlated with the amplitude of the following cycle. This data provides a prediction for the maximum sunspot number of cycle based on the average ratio of sunspot number maximum to the aa index minimum for these 13 cycles. Using the aa index minimum near cycle 24/25 minimum indicates a maximum sunspot number of 132 for cycle 25.
Our previous prediction was based on our early (2016 and 2018) predictions of what the Sun's polar fields would be at cycle minimum (late 2019). See more on this work below.
Discover the Cycle 24/25 Predictions!
Predicting the behavior of a sunspot cycle is fairly reliable once the cycle is well underway (pdf-file here). In the 1990s, NASA/MSFC Solar Physics Branch members David Hathaway, Robert Wilson, and Edwin Reichmann studied the sunspot and geomagnetic records for characteristic behavior that might help in predicting future sunspot activity. Among the most reliable techniques at that time were those that use the measurements of changes in the Earth's magnetic field at, and before, sunspot minimum, e.g. "geomagnetic precursors" that we believe are linked the the Sun's polar fields. Details can be found in two papers here and here.
By early 2009 (a year after Cycle 23/24 minimum) our prediction for Sunspot Cycle 24 gave a smoothed sunspot number (V2.0) maximum of about 101 in late 2013. The actual smoothed sunspot number reached a peak of 116.4 in April 2014. This has become the official maximum. Cycle 24 was double peaked, the second peak surpassed the level of the first peak (98.3 in March 2012). Many cycles are double peaked but this is the first in which the second peak in sunspot number was larger than the first. Cycle 24 is now done. The predicted and observed size of Cycle 24 makes it the smallest sunspot cycle in 100 years - since Cycle 14 which had a maximum smoothed sunspot number V2.0 of 107.2 in February of 1906.
In 2016 (more than three years before Cycle 24/25 minimum) we predicted that Cycle 25 would be another small cycle, with an amplitude perhaps slightly smaller than the size of Cycle 24. This prediction was based on estimates and measurements of the Sun's polar magnetic fields (pdf-file here). Further details about this predictions can be found in this paper.
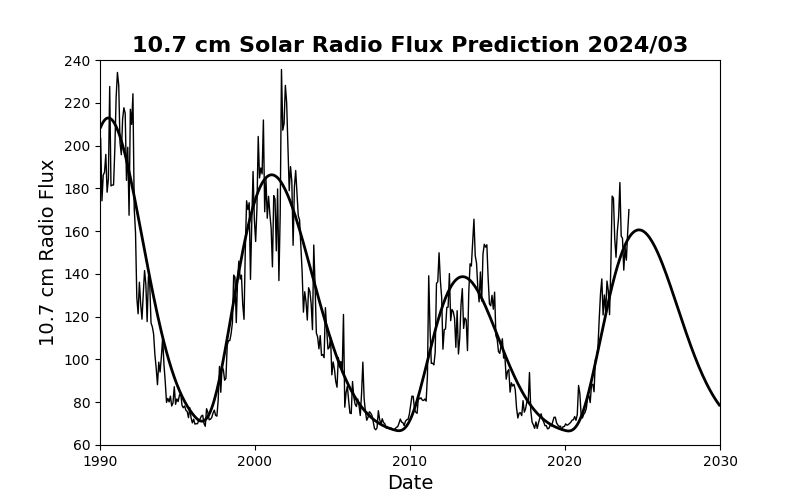
Another indicator of the level of solar activity is the flux of radio emission from the Sun at a wavelength of 10.7 cm (2.8 GHz frequency). This flux has been measured daily since 1947. It is an important indicator of solar activity because it tends to follow the changes in the solar ultraviolet that influence the Earth's upper atmosphere and ionosphere better than sunspot number. Many models of the upper atmosphere use the 10.7 cm flux (F10.7) as input to determine atmospheric densities and satellite drag. F10.7 does follow the sunspot number quite closely and similar prediction techniques can be used. Our predictions for F10.7 are available in a text file and as a png image. Current values for F10.7 can be found at: ftp://ftp.seismo.nrcan.gc.ca/spaceweather/solar_flux/daily_flux_values/fluxtable.txt.
Solar Cycle 24 and 25 F10.7 Flux Prediction.The data used to make these plots are located in this text file.
Discover the Cycle 24 Polar Field Predictions!
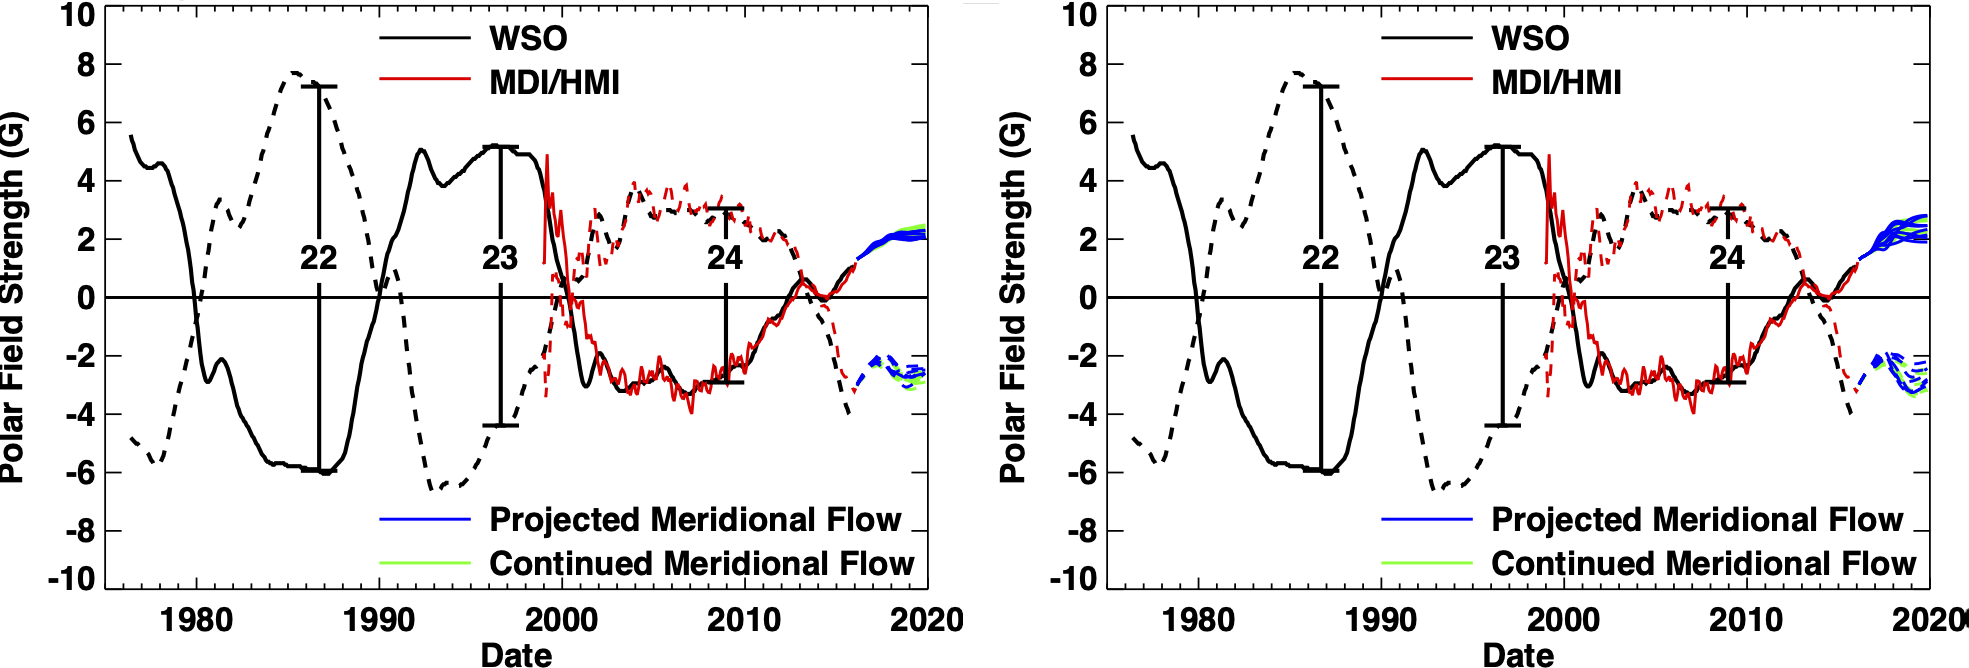
We have used our AFT code to predict the amplitude and hemispheric asymmetry of the Sun’s polar magnetic fields at the start of 2020, approximately the next cycle minimum. (Recall that observations have shown that the strength of the polar fields is a good indicator of the strength of the next cycle.) While we do not know the details of the active region sources and transport flows that will occur between now and then, we use knowledgeable estimates, along with their known variability, to produce a series of 32 realizations for the evolution of the Sun’s surface magnetic field from the end of January 2016 to the start of January 2020. More information about these predictions can be found in this paper.
Solar Cycle 24 Polar Field Predictions. The left plot shows 16 predictions with 8 variations in the convective flow pattern and 2 variation in the meridional flow profile. The right plot shows 16 predictions with 8 variations in the Joy's Law tilt and 2 variation in the meridional flow profile. All 32 realizations predict the polar fields for the coming minumun will be similar in strength (or slightly weaker) than the polar fields that were seen during the last solar minimum.
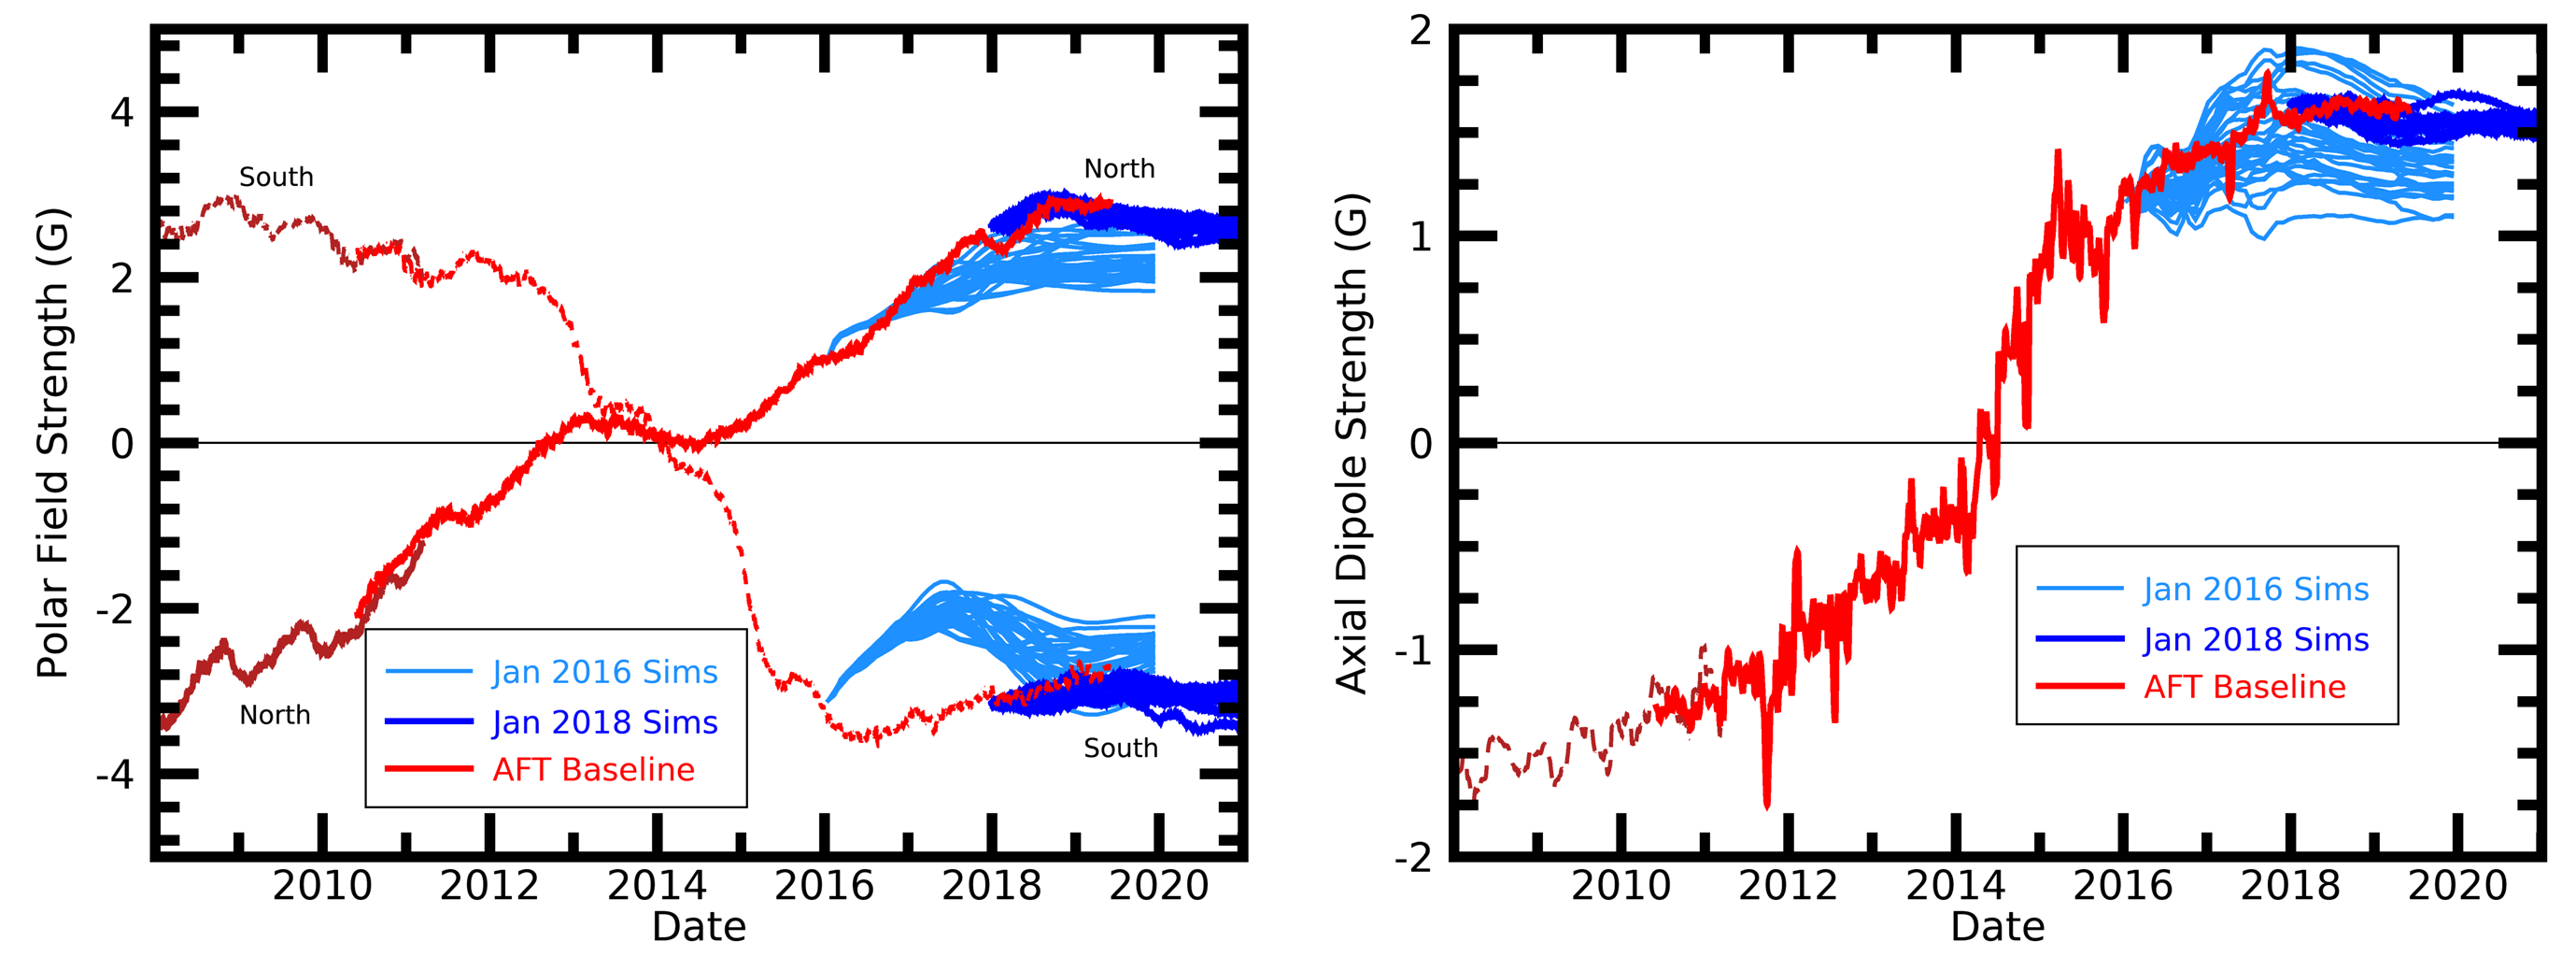
In 2019 we updated our simulations with the through the beginning of 2019 and repeated our simulations. More information about these updated predictions can be found in this paper.
AFT 2018 predictions and observations to date. This figure shows the polar field observations (red) along with the AFT predictions (2016 in the lighter blue and 2018 in the darker blue). The polar fields strengths as measured from 55° and above are shown on the top. The polar field strength as measured from the axial dipole moment is shown on the bottom. Observations since these predictions were made are in agreement.
 Solar Cycle Science Discover the Sun!
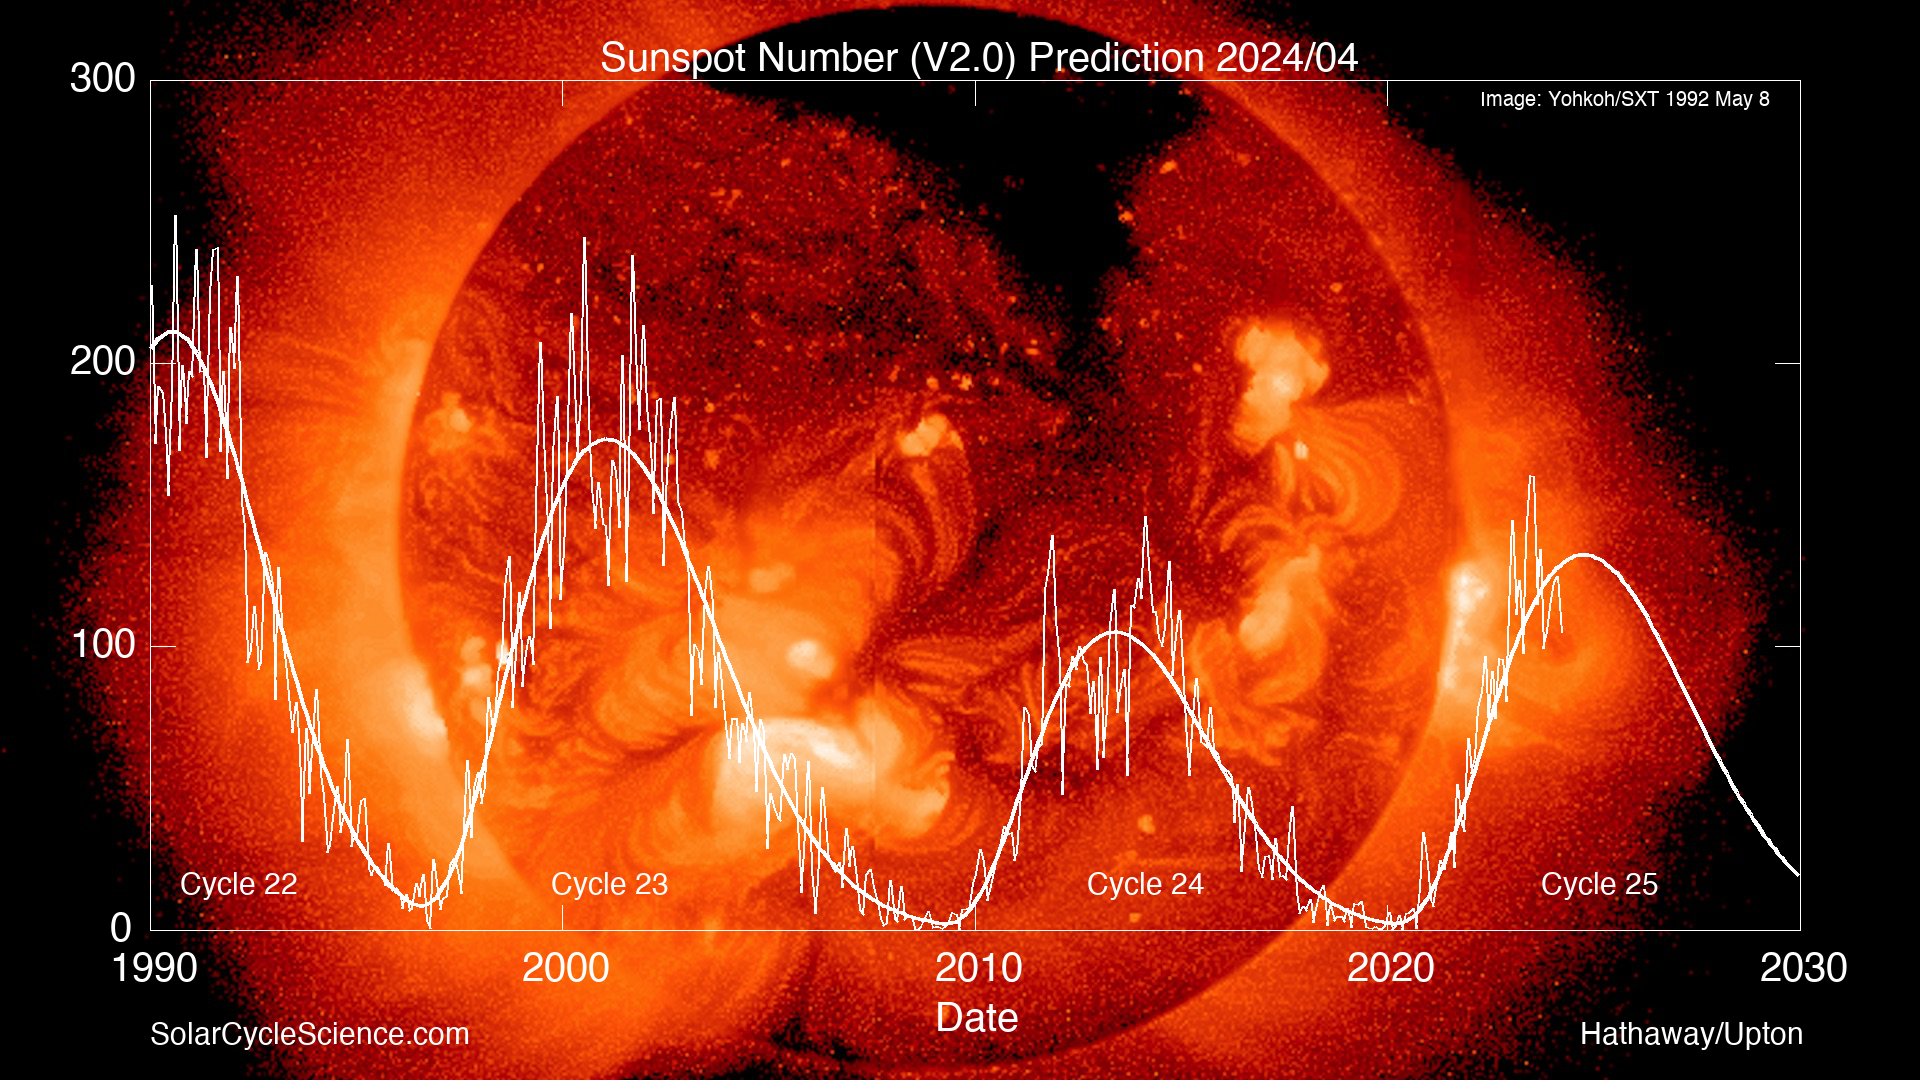